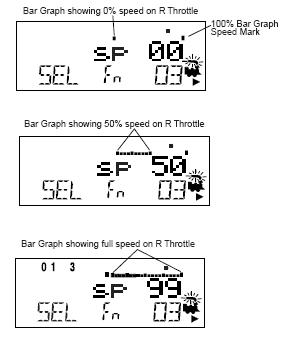
Each throttle has a bar graph located above the text area of the LCD.
Each bar graph indicates the speed setting of the L & R Throttles graphically from a single dot (0% throttle) to 20 dots (full throttle). This is useful when the text area is showing information other than speed.